What Is Bond Yield? Key Concepts and How to Calculate It
By Markets & Investing DeskUpdated Nov 10, 2026
Definition
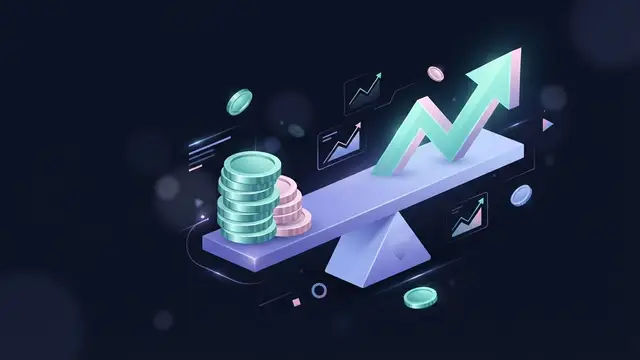
Bond yield is the return an investor earns from holding a bond, expressed as an annual percentage of the price paid. Because a bond's price changes, its yield moves in the opposite direction.
Key takeaways
- Bond yield measures a bond's return relative to its price, not just the interest rate printed on it.
- Price and yield move in opposite directions.
- The coupon rate and current yield are quick measures. Yield to maturity (YTM) is fuller because it includes every remaining payment, the gain or loss at maturity and the time value of money.
- Bond equivalent yield (BEY) and effective annual yield (EAY) annualize semi-annual yields in two different ways.
- Higher yields compensate investors for more risk, such as weaker credit quality or a longer wait to be repaid.
Bond yield is the return an investor earns from holding a bond, expressed as an annual percentage of what the bond costs. A bond’s coupon, the interest payment written into the bond, never changes. Its market price does change, so the yield a buyer actually locks in depends on the price paid. That is why two investors holding the same bond can earn different yields: one bought at issue for face value, the other bought later at a discount or a premium.
What a bond is, and where yield comes from
A bond is a loan from the investor to the issuer, which may be a government, a municipality or a company. The bond has three defining terms:
- Face value (par value): the amount the issuer repays at maturity, commonly $1,000 per bond for U.S. corporate bonds.
- Coupon: the fixed interest payment, stated as a percentage of face value and usually paid annually or semi-annually.
- Maturity date: the date the face value is repaid and the bond ends.
At issue, a bond is often sold at or near face value, so its yield roughly equals its coupon rate. After that, it trades in the secondary market at whatever buyers and sellers will pay. Face value stays fixed for the life of the bond. Market price can sit above par (a premium) or below par (a discount), and it converges toward face value as maturity approaches.
The issuer sets the coupon when the bond is created. After that, the market sets the yield. If investors demand more return for a given level of risk and maturity, the only way an existing bond with a fixed coupon can offer that return is for its price to fall.
How to calculate bond yield
Coupon rate
The simplest measure divides the annual coupon by face value:
Coupon rate = Annual coupon payment ÷ Face value
Hypothetical example: a bond with a $1,000 face value that pays $100 a year has a coupon rate of 10% ($100 ÷ $1,000). This number is fixed at issue and does not change when the bond’s price changes. It describes the bond’s terms, not the return a new buyer receives.
Current yield
Current yield uses the market price instead of face value:
Current yield = Annual coupon payment ÷ Current market price
If the same bond trades at $927.90, its current yield is $100 ÷ $927.90 = 10.78%. If it trades at $1,079.85, its current yield is $100 ÷ $1,079.85 = 9.26%. Current yield tells you the income return on the money you put in today.
Neither measure is complete. The coupon rate ignores price entirely. Current yield ignores what happens at maturity: a buyer who pays $927.90 receives $1,000 at the end, a $72.10 gain the formula leaves out, while a buyer who pays $1,079.85 takes a $79.85 loss. Both measures also ignore when payments arrive and how often.
Why bond prices and yields move in opposite directions
The inverse relationship follows directly from the fixed coupon.
Hypothetical example: an investor buys a newly issued bond with a $1,000 face value, a 10% annual coupon and five years to maturity. It pays $100 a year. Now suppose yields on comparable bonds (same credit quality, same maturity) rise to 12%. A new buyer can get $120 a year from a fresh $1,000 bond, so nobody will pay $1,000 for one that pays $100. To sell the original bond, its price has to drop until the five $100 coupons plus the $1,000 repayment deliver a 12% return to the buyer. That price is $927.90.
Reverse the scenario. If comparable yields fall to 8%, a bond paying $100 a year becomes more attractive than new bonds paying $80. Buyers bid its price up until its return falls to 8%, which happens at about $1,079.85.
So when news reports say bond yields went up, bond prices fell. That is good news for someone about to buy bonds and bad news for someone already holding them and planning to sell before maturity. An investor who holds a bond to maturity still receives every coupon and the full face value (assuming the issuer does not default), so price swings along the way matter only if the bond is sold.
Longer-maturity bonds react more strongly to a given change in yields, because more of their cash flows sit far in the future where discounting has a bigger effect. Bond duration is the standard measure of that sensitivity.
What drives yields up or down
Because the market sets yields, they respond to anything that changes the return investors require:
- Interest rate expectations. Central bank policy rates feed directly into short-term yields and influence longer ones.
- Inflation. Fixed coupons lose purchasing power when prices rise, so higher expected inflation pushes yields up.
- Credit risk. The more doubt about an issuer’s ability to pay, the more yield investors demand.
- Maturity. Lending for longer exposes the investor to more uncertainty, which often, though not always, means a higher yield.
- Supply and demand for a particular issue or type of bond.
Yield to maturity (YTM)
Yield to maturity is the single discount rate that makes the present value of all a bond’s remaining cash flows equal to its current price. Those cash flows are every remaining coupon plus the face value at maturity. YTM therefore captures income, the gain or loss from price converging to par, and the timing of each payment.
Formally:
Price = C ÷ (1 + y) + C ÷ (1 + y)² + … + (C + FV) ÷ (1 + y)ⁿ
where C is the coupon per period, FV is face value, n is the number of periods and y is the yield per period. There is no algebraic shortcut to solve for y; it is found by trial and error, which financial calculators, spreadsheets (the RATE or YIELD functions) and bond platforms do automatically.
Running the earlier bond at 12%: each of the five $100 coupons and the final $1,000 is discounted at 12% per year, and the present values add up to $927.90. So a bond priced at $927.90 with those terms has a YTM of 12%.
A widely used approximation avoids iteration:
Approximate YTM = [C + (FV − PV) ÷ t] ÷ [(FV + PV) ÷ 2]
- C = annual coupon payment
- FV = face value
- PV = current price
- t = years to maturity
For the example: [$100 + ($1,000 − $927.90) ÷ 5] ÷ [($1,000 + $927.90) ÷ 2] = $114.42 ÷ $963.95 = about 11.87%. That is close to the true 12% but not equal, which is why the shortcut works for estimates and not for pricing.
YTM rests on assumptions: the investor holds the bond to maturity, the issuer makes every payment on time, and each coupon is reinvested at the same yield. If reinvestment rates turn out lower or higher, the investor’s realized return will differ from the YTM quoted at purchase.
Bond equivalent yield (BEY)
Many bonds, including U.S. Treasury notes and bonds and most U.S. corporate bonds, pay coupons twice a year. Their YTM is first calculated per six-month period, then annualized for quoting. The convention for that annualization is the bond equivalent yield:
BEY = Semi-annual yield × 2
Hypothetical example: take the same $1,000 bond with a 10% coupon, but paid as $50 every six months, with ten payments remaining and a price of $927.90. Solving for the per-period yield gives 5.979%. The BEY is 5.979% × 2 = 11.958%.
For a bond with annual coupons, YTM and BEY are the same number. For semi-annual bonds, the BEY is the figure usually shown as the bond’s yield. Because it is a simple multiplication, it ignores the fact that the first half-year’s payment could itself earn a return in the second half.
Effective annual yield (EAY)
Effective annual yield adds that compounding back in:
EAY = (1 + i ÷ n)ⁿ − 1
- i = nominal annual rate (the BEY, as a decimal)
- n = number of compounding periods per year
For the semi-annual example: (1 + 0.11958 ÷ 2)² − 1 = (1.05979)² − 1 = about 12.32%.
The EAY is higher than the BEY whenever there is more than one payment per year, because it includes interest on interest. The gap matters when comparing a semi-annual bond with an investment quoted on an annual compounding basis, such as a savings product’s APY. Comparing a BEY directly with an APY slightly understates the bond’s return.
Example of bond yield: one bond, five measures
All figures below use the same hypothetical bond: $1,000 face value, 10% coupon, five years to maturity, bought at $927.90.
| Measure | Annual coupons | Semi-annual coupons ($50 × 10) |
|---|---|---|
| Coupon rate | 10.00% | 10.00% |
| Current yield | 10.78% | 10.78% |
| YTM (per period) | 12.00% | 5.979% |
| BEY | 12.00% | 11.958% |
| EAY | 12.00% | 12.32% |
YTM, BEY and EAY all reflect the full return if the bond is held to maturity, quoted under different annualization conventions. When two yields are compared, they need to be the same type of yield, on the same convention.
Credit ratings and yield
Credit ratings grade an issuer’s ability to pay interest and principal on time. The best-known U.S. agencies are S&P Global Ratings, Moody’s Investors Service and Fitch Ratings. Scales run from AAA (Aaa at Moody’s), the highest credit quality, down to D, which indicates default.
Bonds rated BBB− or higher by S&P and Fitch (Baa3 or higher by Moody’s) are considered investment grade. Bonds rated below that are called high-yield or, informally, junk bonds. They pay more because investors require compensation for a greater chance of missed payments or default.
A higher yield is therefore not automatically a better investment. It is the price of taking more risk. Low-yield bonds such as Treasuries suit investors who want a high degree of safety or who hold them to steady a portfolio that also contains stocks. High-yield bonds suit investors who accept a meaningful risk of loss in exchange for more income. A rating can be revised, and a downgrade typically pushes a bond’s yield up and its price down.
How investors use bond yields
Comparing bonds. YTM puts bonds with different coupons, prices and maturities on a common footing. A 4% coupon bond at a discount and a 6% coupon bond at a premium can turn out to offer similar yields to maturity.
The yield curve. Plotting yields on bonds of the same credit quality, typically Treasuries, across maturities produces the yield curve. Its slope is read as a signal about expected interest rates and economic activity. A normal curve slopes upward; an inverted curve, where short-term yields exceed long-term ones, has historically drawn attention as a possible recession signal.
Yield spreads. A spread is the difference between two yields, for example a AAA corporate bond versus a Treasury of similar maturity, usually expressed in basis points (1 basis point equals 0.01 percentage point). Widening credit spreads mean investors are demanding more compensation for credit risk.
Comparing after-tax returns. Interest on most U.S. municipal bonds is exempt from federal income tax. The tax-equivalent yield converts a muni yield into the taxable yield that would leave the investor with the same income: Tax-equivalent yield = Municipal yield ÷ (1 − marginal tax rate). Hypothetical example: a 3% muni for an investor in a 32% bracket equals 3% ÷ 0.68 = about 4.41% on a taxable bond.
Bond fund yields
Bond funds and bond ETFs hold many bonds and never mature as a whole, so their yields work differently from a single bond’s:
- SEC yield (30-day yield): a standardized figure U.S. funds are required to calculate the same way, based on the income earned over the past 30 days minus expenses, annualized. It makes funds comparable with each other.
- Distribution yield: recent distributions divided by the fund’s price or net asset value (NAV). It reflects what was paid out, which can include items other than interest.
- Average yield to maturity of holdings: the weighted YTM of the portfolio, often shown in fund fact sheets.
A fund’s share price is not pulled back toward a face value the way an individual bond’s price is. When yields rise, the fund’s NAV falls, and there is no maturity date at which the loss is guaranteed to reverse, although new bonds bought at higher yields raise the fund’s income over time.
Limitations of bond yield
Yield is not total return. Yield to maturity is a forecast that holds only under its assumptions. An investor who sells early earns the coupons received plus or minus the change in price, which can be far from the yield at purchase. Total return, like return on investment, is measured after the fact.
Default risk. Every yield calculation assumes all payments arrive. A high YTM on a distressed bond reflects the market’s doubt that they will.
Callable bonds. Many corporate and municipal bonds can be redeemed early by the issuer, usually when rates have fallen. For these, yield to call (YTC) and yield to worst, the lowest of YTM and all possible yields to call, give a more realistic picture than YTM.
Inflation. Yields are nominal. The real return is roughly the yield minus inflation, so a 5% yield during 4% inflation buys far less than the same yield during 1% inflation.
Partial periods and accrued interest. Textbook examples assume a whole number of periods remain, which is rarely the case. Hypothetical example: a bond with semi-annual $50 coupons has four years and eight months to maturity, so four months of the current coupon period have passed. The buyer will receive the full next $50 coupon and so compensates the seller with about $50 × 4 ÷ 6 = $33.33 of accrued interest (actual day-count conventions vary by bond type). Bond prices are typically quoted as the clean price, which excludes accrued interest. The dirty price, or full price, includes it and is what the buyer actually pays. Yield calculations also need fractional exponents to handle the partial period.
FAQs
Can a bond yield be negative?
Yes. If buyers pay more for a bond than the total of its remaining coupons and face value, the yield to maturity is below zero. Some government bonds in Europe and Japan traded at negative yields in the 2010s, when investors accepted a small guaranteed loss for safety or regulatory reasons.
The Bottom Line
Anyone buying, holding or comparing bonds and bond funds needs to know which yield a quote reflects. Yield to maturity gives the fullest picture for a bond held to maturity, comparisons only work between the same type of yield on the same convention, and a higher yield signals more risk. Investors who may sell early, own callable bonds or face rising inflation should treat any quoted yield as an estimate of what they will actually earn.