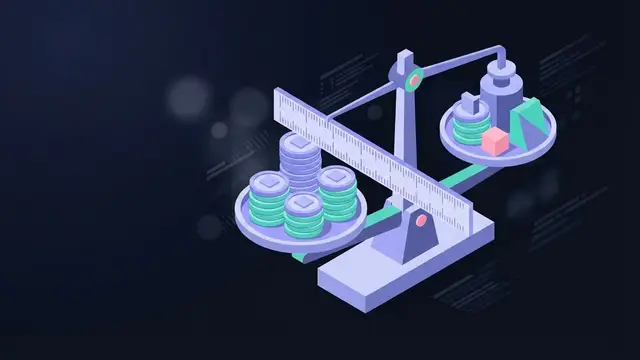
What Is a Balance Sheet? Components and Examples
By Markets & Investing DeskUpdated Nov 10, 2026

Definition
A balance sheet is a financial statement showing what a company owns, what it owes and what belongs to its owners on one date, with assets always equal to liabilities plus equity.
Key takeaways
- A balance sheet is a snapshot of financial position on a single date, not a record of performance over a period.
- Assets are funded by liabilities or equity, so Assets = Liabilities + Equity holds after every transaction.
- Assets are listed by liquidity and liabilities by due date, each split into current (within one year) and non-current.
- Shareholders' equity is a book value, not market capitalization.
A balance sheet is a financial statement that reports what a company owns (assets), what it owes (liabilities) and the residual amount belonging to its owners (shareholders’ equity) as of one specific date. It always satisfies the accounting equation, Assets = Liabilities + Shareholders’ Equity, hence the name: the two sides must balance. It is one of the three core financial statements, with the income statement and the cash flow statement, and investors, lenders and managers use it to judge liquidity, leverage and financial health.
What the Balance Sheet Shows
The balance sheet answers three questions about a business at a moment in time:
- What resources does it control? Cash, receivables, inventory, buildings, equipment, investments and acquired intangibles.
- What claims do outsiders have on those resources? Supplier bills, wages owed, taxes, loans, bonds, lease obligations and other debts.
- What is left for the owners? The difference between the first two, made up of the capital shareholders contributed plus profits the company has kept.
Under International Financial Reporting Standards (IFRS) and at many companies worldwide it is called the “statement of financial position,” and some banks use “statement of condition.” Account names vary too (“trade receivables” versus “accounts receivable, net”), but the structure stays the same.
How a Balance Sheet Works: The Accounting Equation
The balance sheet formula is:
Assets = Liabilities + Shareholders’ Equity
Rearranged, it defines equity:
Equity = Assets − Liabilities
Everything a company owns had to be paid for, either with money borrowed from creditors or with money supplied by owners, including profits left in the business. The right side shows where the funding came from; the left side shows what it was turned into.
Because modern bookkeeping uses double entry, every transaction affects at least two accounts in a way that keeps the equation in balance. The following hypothetical transactions for a small company show the mechanics:
- Borrowing. A $10,000 three-year bank loan raises cash (an asset) and long-term debt (a liability) by $10,000 each.
- Raising equity. Investors buy $25,000 of new shares. Cash and shareholders’ equity each rise by $25,000.
- Buying inventory with cash. Spending $6,000 on goods for resale lowers cash and raises inventory by $6,000. Total assets are unchanged.
- Buying on credit. $3,000 of supplies on 30-day terms raises inventory and accounts payable by $3,000.
- Repaying debt. Paying $2,000 of loan principal lowers cash and debt by $2,000, so both sides shrink equally.
- Earning a profit. Sales and their costs leave $4,000 of net income for the period. Net assets rise by $4,000, and so do retained earnings, part of equity.
If a balance sheet does not balance, something is wrong: a transaction posted to one account but not its offset, a misclassified item, an inventory counting error, a currency translation mistake or a calculation error. A balance sheet that balances can still contain errors: a sale recorded twice inflates receivables and equity by the same amount.
Why Dates Matter
A balance sheet is dated “as of” a single day, such as “As of December 31,” while the income statement and cash flow statement cover a period, such as “For the year ended December 31.”
The date is usually the last day of the fiscal quarter or fiscal year, which need not match the calendar year. Many businesses end their year at the low point of their annual cycle, the natural business year; a retailer might close after the holiday season once inventory has been sold down. The year-end snapshot may therefore understate typical receivables or inventory.
Because of this timing mismatch, analysts combining a balance sheet figure with an income statement figure often use an average balance: opening plus closing amounts, divided by two. Average total assets roughly represent the asset base that generated a year of profit.
Balance Sheet Structure and Format
The Five Sections
However it is laid out, a classified balance sheet groups accounts into five sections:
- Current assets: items expected to be converted to cash or used up within one year (or within the operating cycle, if longer).
- Non-current assets: longer-lived resources such as property, plant and equipment.
- Current liabilities: obligations due within one year.
- Non-current liabilities: obligations due after one year.
- Shareholders’ equity: capital contributed by owners plus retained earnings and related accounts.
Report Form vs. Account Form
Balance sheets use one of two layouts:
- Account form (horizontal): assets on the left, liabilities and equity on the right, with matching totals at the bottom.
- Report form (vertical): assets at the top, then liabilities, then equity. Most companies use this format in annual reports and regulatory filings.
U.S. companies reporting under Generally Accepted Accounting Principles (GAAP) typically list assets from most to least liquid. Some IFRS reporters put non-current assets first and sometimes present equity before liabilities; totals are unaffected.
Comparative and Common-Size Balance Sheets
Published balance sheets are usually comparative, showing the prior year-end beside the current date. A common-size balance sheet expresses every line as a percentage of total assets: inventory at 19% of assets against 12% last year stands out even if the company has grown, and percentages ease comparison across companies of different sizes.
Units and Headings
A formal heading gives the company name, statement title and date (“As of December 31, 20XX”). Large companies round figures, so check the unit of presentation, such as “(in thousands)” or “(in millions, except per-share amounts)”; missing it can make a figure look 1,000 times smaller than it is.
Components of a Balance Sheet
Assets
An asset is a resource the company controls that is expected to provide future economic benefit. Assets are listed from top to bottom in order of liquidity, meaning how quickly and reliably they can be turned into cash.
Current assets typically appear in this order:
- Cash and cash equivalents: currency, bank balances and very short-term, highly liquid instruments such as Treasury bills and short-term certificates of deposit.
- Marketable securities: stocks and bonds held for the short term that trade in a liquid market.
- Accounts receivable (AR): amounts customers owe for goods or services already delivered, reported net of an allowance for doubtful accounts, management’s estimate of what will not be collected.
- Inventory: raw materials, work in progress and finished goods, carried at cost and written down if value falls below cost. The cost flow method (such as FIFO or LIFO) affects the amount.
- Prepaid expenses: advance payments for future benefits, such as insurance, rent or advertising contracts.
Non-current assets include:
- Long-term investments: securities and stakes not expected to be sold within the next year.
- Property, plant and equipment (PP&E): land, buildings, machinery, vehicles and other durable assets, shown at cost less accumulated depreciation (land is not depreciated). Spending on them is capital expenditure.
- Intangible assets: patents, trademarks, software, customer relationships and goodwill, the excess paid in an acquisition over the fair value of the net identifiable assets acquired.
Under GAAP, most internally developed intangibles are not recorded; the costs of building a brand or doing research are generally expensed. Intangibles usually reach the balance sheet only when purchased, often in an acquisition. A company with a famous in-house brand may show little intangible value, while an acquirer may carry goodwill that later proves overstated and is written down.
Liabilities
A liability is an obligation to transfer money, goods or services to an outside party such as suppliers, lenders, employees, customers, tax authorities or bondholders.
Current liabilities commonly include:
- Accounts payable: amounts owed to suppliers on invoices, often due within about 30 days; for many businesses the largest current liability.
- Wages payable: pay and benefits employees have earned but not yet received.
- Interest payable: interest accrued but not yet paid.
- Short-term debt and the current portion of long-term debt: loans due within 12 months. With ten years left on a warehouse loan, the principal due in the next year is current and the remaining nine years are long-term.
- Customer prepayments (unearned or deferred revenue): cash received before delivery; the company owes the delivery or a refund. Insurers’ unearned premiums work the same way.
- Dividends payable: dividends declared but not yet paid.
- Income taxes payable: taxes owed for the period but not yet remitted.
Long-term liabilities commonly include:
- Long-term debt: bank loans and bonds due after one year, carried at principal (adjusted for any discount or premium).
- Lease liabilities: under U.S. GAAP (ASC 842) and IFRS 16, most leases longer than 12 months are recorded as a liability with a matching right-of-use asset.
- Pension liabilities: the amount by which defined benefit pension obligations exceed the plan assets set aside to pay them.
- Deferred tax liabilities: future taxes arising from differences between financial reporting and tax rules, commonly depreciation that runs faster on the tax return.
Some obligations never appear as line items. Certain guarantees, purchase commitments and arrangements with unconsolidated entities are off-balance-sheet items, disclosed (when required) only in the footnotes.
Shareholders’ Equity
Shareholders’ equity, also called stockholders’ equity, owners’ equity or net assets, is total assets minus total liabilities. It represents the owners’ residual claim after all creditors are paid. In a sole proprietorship it usually appears as a single owner’s capital account. In a corporation it is broken into several accounts:
- Common stock: shares issued multiplied by par value, a nominal legal figure often as small as $0.01 per share with no connection to market price.
- Preferred stock: shown separately, also at par.
- Additional paid-in capital (APIC): also called capital surplus, the amount investors paid above par. Common stock plus APIC reflect the cash raised by selling stock.
- Retained earnings: cumulative net income minus all dividends paid, kept to reinvest or pay down debt. Persistent losses can make it negative, an accumulated deficit.
- Treasury stock: shares the company has bought back, shown as a deduction from equity. They can be reissued to raise cash or used for employee compensation.
- Accumulated other comprehensive income (AOCI): gains and losses that bypass net income, such as foreign currency translation adjustments and some unrealized investment gains or losses.
Example of a Balance Sheet
A hypothetical balance sheet for a small wholesale distributor, Northgate Supply Co., in report form:
Northgate Supply Co. Balance Sheet, As of December 31 (hypothetical, in U.S. dollars)
| Line item | Amount |
|---|---|
| Current assets | |
| Cash and cash equivalents | 40,000 |
| Accounts receivable, net of allowance | 55,000 |
| Inventory | 80,000 |
| Prepaid expenses | 5,000 |
| Total current assets | 180,000 |
| Non-current assets | |
| Property, plant and equipment, net | 220,000 |
| Intangible assets | 20,000 |
| Total non-current assets | 240,000 |
| Total assets | 420,000 |
| Current liabilities | |
| Accounts payable | 45,000 |
| Wages payable | 10,000 |
| Current portion of long-term debt | 20,000 |
| Unearned revenue | 15,000 |
| Total current liabilities | 90,000 |
| Non-current liabilities | |
| Long-term debt | 130,000 |
| Deferred tax liability | 10,000 |
| Total non-current liabilities | 140,000 |
| Total liabilities | 230,000 |
| Shareholders’ equity | |
| Common stock, $0.01 par | 10,000 |
| Additional paid-in capital | 90,000 |
| Retained earnings | 100,000 |
| Treasury stock | (10,000) |
| Total shareholders’ equity | 190,000 |
| Total liabilities and shareholders’ equity | 420,000 |
The check: total liabilities of $230,000 plus equity of $190,000 equals total assets of $420,000. Note also that the loan appears in two places. The $20,000 due in the next 12 months is a current liability, and the remaining $130,000 is long-term debt.
How to Read a Balance Sheet
Using the Northgate example, a practical sequence moves from the totals to the relationships between them.
1. Confirm the Basics
Check the date, the unit of presentation and whether the statement is consolidated (combining a parent and its subsidiaries). Make sure the totals balance, then compare each major line with the prior-year column.
2. Test Short-Term Liquidity
- Working capital = current assets − current liabilities = $180,000 − $90,000 = $90,000.
- Current ratio = current assets ÷ current liabilities = $180,000 ÷ $90,000 = 2.0.
- Quick (acid-test) ratio = (cash + marketable securities + receivables) ÷ current liabilities = ($40,000 + $55,000) ÷ $90,000 = about 1.06. The quick ratio leaves out inventory and prepaid expenses because they cannot be turned into cash as quickly or reliably.
The gap between Northgate’s current ratio and its quick ratio shows how much of its liquidity depends on selling inventory.
3. Assess Leverage and Solvency
Leverage ratios show how much of the asset base creditors fund. Definitions vary, so check which version a source uses:
- Debt-to-equity, using interest-bearing debt = ($20,000 + $130,000) ÷ $190,000 = about 0.79.
- Total liabilities to equity = $230,000 ÷ $190,000 = about 1.21.
- Debt ratio = total liabilities ÷ total assets = $230,000 ÷ $420,000 = about 0.55, meaning creditors fund roughly 55% of the assets.
Higher leverage magnifies shareholder returns in good times and raises the risk of financial distress in bad ones. Utilities and banks routinely carry far more liabilities relative to equity than software companies, so compare within a sector.
4. Connect It to the Income Statement
Ratios that combine balance sheet items with the income statement use average balances. Suppose, hypothetically, that Northgate earned net income of $42,000 and had total assets of $380,000 at the prior year-end:
- Average total assets = ($380,000 + $420,000) ÷ 2 = $400,000.
- Return on assets (ROA) = $42,000 ÷ $400,000 = 10.5%.
Return on equity (ROE) divides net income by average equity. Asset turnover divides revenue by average total assets. Turnover ratios for receivables, inventory and payables feed the cash conversion cycle, how long cash is tied up between paying suppliers and collecting from customers; a lengthening cycle shows up as rising receivables and inventory relative to sales.
5. Read the Changes and the Footnotes
Changes between two balance sheets explain much of the cash flow statement: a jump in receivables means sales booked but not collected, and rising debt with falling cash may mean borrowing is funding operations. The footnotes disclose the inventory method, depreciation policies, debt maturities, lease terms, pension assumptions and contingencies.
Why Is a Balance Sheet Important?
- Investors use it to judge financial strength, calculate ratios and see how growth is funded. Growing sales generally require more inventory, receivables and equipment, and whether supplier credit, debt or retained profit pays for them says a lot about risk.
- Lenders and private equity investors typically require one before funding a business, and lenders often set covenants on balance sheet ratios, such as a minimum current ratio or a maximum debt level.
- Managers use it to check whether cash covers upcoming obligations, whether borrowing is excessive and whether to raise capital through debt or equity.
- Employees, suppliers and customers of public companies can see a business’s cash and debt, which bears on job security, getting paid and warranty support.
Who Prepares the Balance Sheet?
In a small private company, the owner or a bookkeeper may prepare the balance sheet, often with accounting software; mid-sized firms often have an outside accountant review or audit it, sometimes at a lender’s request. U.S. public companies report under GAAP and file with the Securities and Exchange Commission (SEC): audited annual statements in Form 10-K and reviewed, unaudited quarterly statements in Form 10-Q. Many companies outside the United States use IFRS, so similar businesses may present different line items.
Limitations of a Balance Sheet
It is a single moment. One balance sheet shows no trend. $1 million of cash may mean strength or a dwindling reserve; without the prior balance, the income statement and the business’s operating needs, the number says little.
Many values are historical or estimated. PP&E is carried at cost less depreciation, not current value, so land bought decades ago can be worth many times its book value. Bad-debt allowances, inventory write-downs and goodwill impairment tests all involve judgment that can materially change the totals.
Accounting choices change the numbers. Inventory and depreciation methods can shift reported assets and equity for otherwise identical companies, and timing payments or collections around the reporting date can make liquidity look better than usual. The footnotes reveal the methods used.
Important resources are missing. Internally built intangibles and off-balance-sheet obligations do not appear, so for companies whose value rests on intangibles, book equity can be a poor guide to economic worth.
It does not measure profitability or cash generation. A strong balance sheet can belong to a loss-making business, and a highly leveraged one to a business with dependable cash flow. Free cash flow and EBITDA come from the other statements.
Industry formats differ. Banks, insurers, utilities and brokerages present balance sheets unlike those of manufacturers or retailers; a bank may not classify items as current and non-current, and its customer deposits are liabilities. Industrial ratio rules of thumb do not transfer.
Balance Sheet vs. Related Concepts
Balance sheet vs. financial statements. “Financial statements” is the umbrella term. A full set includes the balance sheet, the income statement, the cash flow statement, the statement of shareholders’ equity and the accompanying notes. The balance sheet is one part.
Balance sheet vs. income statement. The income statement measures performance over a period: revenue, cost of goods sold, expenses and net income. The balance sheet measures position at a date. They connect through retained earnings, since each period’s net income (minus dividends) flows into equity.
Balance sheet vs. cash flow statement. The cash flow statement explains why cash changed between two balance sheet dates, sorting the movements into operating, investing and financing activities. Much of it can be traced to changes in balance sheet accounts.
Balance sheet vs. trial balance. A trial balance is an internal report listing every ledger account’s debit or credit balance to check that debits equal credits. The balance sheet is the formal, classified statement built from the asset, liability and equity accounts.
Book value vs. market capitalization. Shareholders’ equity is an accounting figure built from contributed capital and retained earnings. Market capitalization is the share price multiplied by shares outstanding, and it reflects investors’ expectations about future profits. The two can differ widely in either direction.
Corporate vs. personal balance sheet. An individual’s version, a net worth statement, subtracts liabilities such as a mortgage, car loans and credit card balances from assets such as cash, investments, a home and vehicles; the difference, net worth, is the personal equivalent of equity.
FAQs
What does it mean when assets, liabilities and equity all go down?
The company ended the period smaller, with less funding from creditors and owners. Typically debt was repaid (cutting cash and liabilities) along with a net loss, dividends or buybacks (cutting assets and equity). Deliberately paying down debt and returning surplus cash is very different from shrinking through losses; the income and cash flow statements show which.
Does the balance sheet formula ever fail to hold?
No; a mismatch means an error. Even when liabilities exceed assets, equity is reported as a negative number (a shareholders' deficit) and the equation still balances.
The Bottom Line
Investors, lenders and managers rely on the balance sheet to judge liquidity, leverage and how a company funds its assets. Read it alongside the prior-year column, the income statement and the footnotes, since book values are often historical or estimated and some resources and obligations never appear. Compare ratios only within the same industry, because banks, utilities and software companies carry very different structures.